Statistical Inference is all about using and applying the language of probability to say how trustworthy are you on the conclusions you make out of your data. When we talk about inferring from the data we naturally talk about the significance level. How significant is a claim on to the true side of a proposition? The simple idea is an outcome that would rarely happen if a claim were true is good evidence that the claim is not true.
"Significant" therefore in statistical sense necessarily does not mean how "important". It just simply means "not likely to happen just by chance" represented by an alpha makes "not likely" more exact.
Now what kind of weird logic is that...LOL
Cigarette companies in their advertising campaigns have an internal rule that if they show a woman model smoking she needs to be of an average age of 25, realistically its always been lower than 25 as revealed by a famous statistic experiment through tests of Significance. I find this interesting. Was just discussing this that you can have knowledge of all statistics and formulas but its application to make sense in the real world is one of the forms of Godly Wisdom.
Thoughts...
Sam Kurien
Showing posts with label statistics. Show all posts
Showing posts with label statistics. Show all posts
Sunday, January 9, 2011

Thursday, December 30, 2010
Probability - And Business Decisions!

So we see the law of large numbers applies as the mean of a fairly accurate sample moves towards the mean of the population (in this case the overall customers) very slowly. The law of large numbers is the foundation of such business enterprises like gambling casinos and insurance companies.The winnings (or losses) of a gambler on a few plays are uncertain - that's why gambling is exciting. If you take 100 gamblers and make 100 observations the mean of the sample is not very close to mean of the population, it is only in the very long run that the mean outcome is predictable. The house plays tens of thousands of times so the the house unlike individual gamblers can count on the long run-regularity described by the law of large numbers. Hence the average winnings the house on tens of thousands of plays will be very close to the mean of the distribution of winnings which translates effectively to say that the mean guarantees the house a profit and that's why gambling like insurance is usually a profitable business. At the end of the day the odds are always stacked up against the consumer.
Thoughts,
Sam Kurien
Randomness & Probability
The idea of probability is empirical. I chuckled when I twittered last night on Einstein's quote that- "God does not care about our mathematical difficulties. He integrates empirically". So probability is the art of observing a class of data closely and describing the data in several trials. Hence Randomness or "Random" behavior in statistics is not a synonym for "haphazard" but a description of a kind of order that emerges only in the long run.
 The French naturalist Count Buffon (1707 - 1788) tossed a coin 4040 times. The results were 2048 times heads which means 0.5069 chances for the heads to occur. Around 1900 Karl Pearson heroically tossed the coin 24,000 times result was 12,012 heads, a proportion of 0.5005. John Kerrich while imprisoned in the German Nazi camp tossed the coin 10,000 times the result of which was 5076 heads, a proportion of 0.5067. So to make a point about randomness and probability we call a phenomenon random if individual outcomes are uncertain but there is a regular distribution of outcomes in a large number of repetitions, what I am interested in is under the density curve how this randomness can be plotted to make accurate assumptions. The probability of any outcome of a random phenomenon is the proportion of times the outcome would occur in a very long series of repetitions.
I think gamblers and lay people always express this idea in terms of "What are the odds rather than probability?" Odds of A to B against an outcome means that the probability of that outcome is B/(A+B). So "odds of 5 to 1" is another way of saying "probability is 1/6". A probability is always between zero and one as per the laws of probability but odds range from to zero to infinity.
I wonder if some of the Vegas regulars apply laws of probability?
Thoughts.
Sam Kurien
I think gamblers and lay people always express this idea in terms of "What are the odds rather than probability?" Odds of A to B against an outcome means that the probability of that outcome is B/(A+B). So "odds of 5 to 1" is another way of saying "probability is 1/6". A probability is always between zero and one as per the laws of probability but odds range from to zero to infinity.
I wonder if some of the Vegas regulars apply laws of probability?
Thoughts.
Sam Kurien
Saturday, December 25, 2010
The Expanding Universe
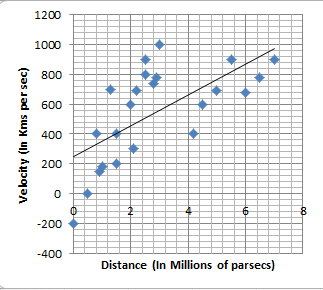
Thinking about regression, I came across Edwin Hubble's data in the Astronomy magazine and found out that the scatter-plot of the data Hubble gave played a central role in the discovery that universe is expanding. The graph below shows the distances from earth of 24 spiral galaxies, just for kicks I plotted this in excel, the speed indicates the speed at which these galaxies are moving away from us as reported in 1929 by Hubble's data.

The scatter-plot clearly indicates a linear relationship my TI-83 reports a r=0.7842 correlation which means that distant galaxies are moving away rapidly. Astronomers believe that there is a perfect linear relationship along with the scatter caused by imperfect measurements. The two lines on the plot are actually the two-least squares regression lines. The regression line of velocity on distance is solid as indicated. The regression line if drawn of distance on velocity will be different and both lines will have different slopes.
Lesson learnt : There is a close connection between correlation and the slope of the least square regression line.
Thoughts.
Sam
The scatter-plot clearly indicates a linear relationship my TI-83 reports a r=0.7842 correlation which means that distant galaxies are moving away rapidly. Astronomers believe that there is a perfect linear relationship along with the scatter caused by imperfect measurements. The two lines on the plot are actually the two-least squares regression lines. The regression line of velocity on distance is solid as indicated. The regression line if drawn of distance on velocity will be different and both lines will have different slopes.
Lesson learnt : There is a close connection between correlation and the slope of the least square regression line.
Thoughts.
Sam
Statistical Thinking - Regression?
Regress means to go backward. How did the term regression come to be? Sir Francis Glaton (1822-1911) was the first one to apply regression techniques on biological and psychological data. He observed data in heights of tall parents and found that often taller than average parents tended to have children who were also taller than average but not as tall as their parents. Galton called this fact "regression" toward the mean and the name came to be applied to statistical method.
 A regression line is very important measure in research then because a regression line summarizes the relationship between independent and dependent variables. as in specific settings one of the variables helps explaining or predicting the other.
Why am I relating this here? I remember a year I talked about visual mapping with mind map, certainly our brain does not always think in linear fashion, thoughts, ideas projects, to do's, likes, dislikes, desires, passions, etc are all over the place. So the question is while amassing information on architecture can you take your visual mindmap and plot out a linear regression?
Thoughts?
Sam
Why am I relating this here? I remember a year I talked about visual mapping with mind map, certainly our brain does not always think in linear fashion, thoughts, ideas projects, to do's, likes, dislikes, desires, passions, etc are all over the place. So the question is while amassing information on architecture can you take your visual mindmap and plot out a linear regression?
Thoughts?
Sam
Sunday, November 28, 2010
Wisdom - Statistical Thinking!

Subscribe to:
Posts (Atom)
-
 Enterprise Architects/IT Teams along with their business counterparts struggle with the idea of how to effectively engage the senior leaders...
 -
 I feel IT Governance is the most an important function under the umbrella of the CIO. Since Technology Governance is a overarching organizat...
 -
Often there is a need to run a Silverlight application full screen. This is often achieved by creating a small button or a link which toggle...